Use of Renewable Energy Sources in the Fight Against Climate Change
Rhys Morgan Ynni am Byth YABenergy ltd. June 2020

UK energy consumption and emissions
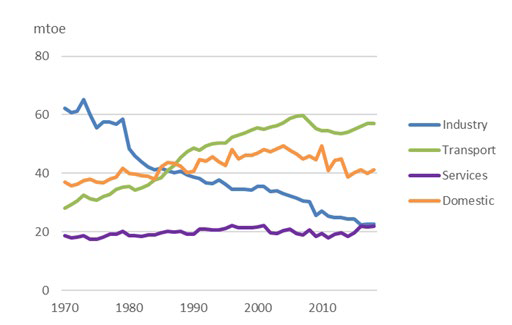
{1} In 2018 UK consumed the equivalent of 143 Million tonnes of oil, 143Mtoe. This equates to 2.3 tonnes of oil per person or 26,000 units of electricity. This was up by 1.1% partly due to increased gas consumption for heat due to the Beast from the East.
Transport takes the lion share, 60Mtoe, services and industry about 20Mtoe and the domestic sector consumes about 43Mtoe. The mix of fuels is also changing with coal use now less than 1%, petroleum remaining steady at 45% and natural gas falling to 30%. Renewables are growing in their share.
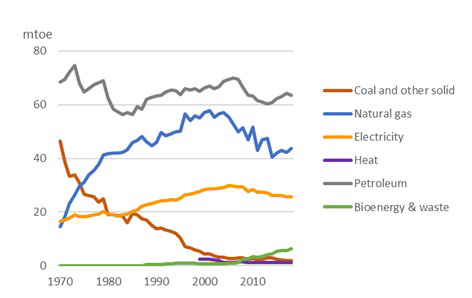
This change in fuel mix from coal to cleaner fuels such as gas, and renewables has meant that our total greenhouse gas emissions have fallen by 42% since 1990.
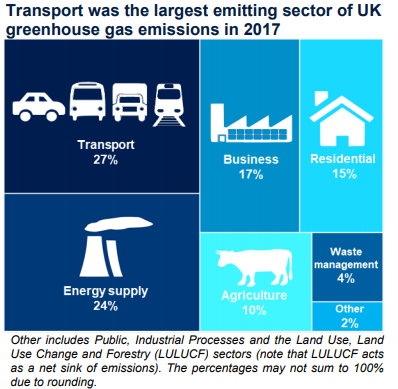
Unsurprisingly transport was the largest emitting sector followed by energy generation. Each one of us is responsible for emitting on average over 7 tonnes of carbon per year.
What can we do to reduce our energy consumption and emissions?
Renewable energy generation has rightfully gained a significant share of the UK’s electricity market. Whilst other renewable energy technologies are able to produce heat directly, e.g. solar thermal and geo thermal most of the common renewable technologies create electricity. Overall renewable technologies displace the equivalent of 22 million tonnes of oil.
The renewables share of electricity generation is now over 33%, up from just 2.6% in 2000. It is a pattern being repeated worldwide. With the cost of wind and solar technology reducing as mass deployment occurs and with no fuel cost to account for renewables are set to play a significant part in our future energy mix.
The hall at Brynberian has installed solar photovoltaic panels which generate electricity that can be used in the building and the surplus sold into the grid. Typically a 4kW PV system will consist of 14-16 panels mounted on the roof. With no moving parts and little maintenance required, the system is expected to generate electricity for at least 20 years. Typically each kW installed can generate about 850kWh of electricity per annum, from a peak of about 6 units per day in summer to near zero on dark winter days.
Wind energy is another option and indeed wind has a large share of the market both offshore and onshore. Many people especially farmers, have invested in small wind turbines however they do have challenges. Planning challenges and reliability issues on smaller machines have disappointed many investors. The return on investment from turbines and solar PV is similar – anything from 4-12% depending on the fraction of renewable electricity that is utilised on site.
Bioenergy has a large share of the renewable sources pie. Typically waste timber is burnt to produce electricity. However many people question the validity of this. You can obviously burn timber quicker than you can grow it and the process releases carbon dioxide adding to the emissions total.
Reducing our energy consumption
Not only can we change how we create our energy but we can all change the way we use energy. Each one of us is able to influence this in many ways, many cost very little. Perhaps the biggest influence we have is to reduce our use of energy in transport. Walking, cycling and using public transport, sharing cars and planning our journeys better can all have a significant effect on our individual carbon emissions.
The total distance travelled per person per year increased 52% between 1975 and 2003, from 4,710 to 7,202 miles per person per year, and has subsequently reduced by 8%.We are also walking and cycling less.
In terms of the hall, Brynberian has installed energy efficient LED lighting and smart controls. LED lights consume 1/10th the energy of incandescent bulbs and last much longer. Together with controls that turn lights on and off automatically, smart use of electricity and using energy efficient appliances can reduce the annual domestic electricity use 3800kWh/yr. considerably.
The most influential factor on typical domestic energy bills is the weather. Reducing heating demand is easily solved by insulating walls, floors and roofs well and draught proofing our homes and halls. Insulation is the most cost effective form of heating! Typical heat loss figures are shown below.
- Up to 25% through the roof.
- Up to 35% through outside walls.
- Up to 25% through doorsand windows.
- Up to 15% through ground floors.
Once we have fixed the leaking bucket we can focus on how we heat our buildings. Installing efficient condensing boilers is a big improvement on solid fuel heaters. Brynberian hall has installed a ground source heat pump. Heat pump technology is basically a fridge working in reverse. We take heat from the ground and pump it into our building. It is reliable, well proven and in the right application can be very efficient. Combined with under floor heating and a well-insulated building, a heat pump can generate 2-4 times more heat energy than it consumes in electrical energy.
Passive design is also very effective. Orientating buildings south towards the sun with large glazed areas and high thermal mass can create a very pleasant environment without costing the earth.
Renovating an old school building poses many challenges, and in terms of energy several additional challenges must be overcome. There are solutions however, take a look at the pictures below of how Brynberian hall is reducing its energy demand and its carbon emissions.
Pictures of PV, HP, wall insulation, electrical controls and sensors etc…
References
- https://assets.publishing.service.gov.uk/government/uploads/system/uploads/attachment_data/file/820843/Energy_Consumption_in_the_UK__ECUK__MASTER_COPY.pdf
- https://assets.publishing.service.gov.uk/government/uploads/system/uploads/attachment_data/file/776083/2017_Final_emissions_statistics_one_page_summary.pdf
- https://assets.publishing.service.gov.uk/government/uploads/system/uploads/attachment_data/file/840014/Chapter_6.pdf
- https://assets.publishing.service.gov.uk/government/uploads/system/uploads/attachment_data/file/674568/analysis-from-the-national-travel-survey.pdf
- https://www.gov.uk/government/statistical-data-sets/annual-domestic-energy-price-statistics
![]()